
Anúncios
Market analysis for crypto investors identifies price drivers, measures volatility with ATR, implied and historical metrics plus volume, and applies position sizing, stops and stress tests to limit drawdowns and preserve capital while enabling disciplined entries and exits.
Market analysis for crypto investors doesn’t have to be a maze. Curious which indicators matter, how to size positions and protect gains when swings hit? This article gives practical steps and quick checks you can try right away.
Anúncios
How volatility behaves in crypto markets
Market analysis for crypto investors starts with watching how price swings behave and why they happen. Simple checks can reveal if a move is a short spike or a lasting trend.
Anúncios
Volatility is normal in crypto, but understanding its causes helps you trade and protect capital with clearer rules.
What drives crypto volatility
Many small markets and big leverage make prices sensitive. News, large orders and sudden shifts in sentiment often spark sharp moves.
Retail flows and algorithmic trades can accelerate swings when liquidity is thin, especially on altcoins.
How to measure volatility
Use a mix of indicators to see different angles of risk.
- Historical volatility: standard deviation of past returns to show typical swings.
- Implied volatility: derived from options, it signals expected future moves.
- Average True Range (ATR): measures recent price range and is useful for stop placement.
- Volume and order book depth: low depth often means larger price impact from orders.
Look for divergence between indicators. High implied but low historical volatility can mean traders expect a big event. The opposite suggests current noise, not a trend.
Patterns matter: intraday spikes often reverse, while extended volatility with volume tends to form trends. Weekends and low-liquidity hours can show exaggerated moves.
Correlation also matters. When Bitcoin swings hard, many altcoins follow. Stress in one large token can spread across the market quickly.
Keep simple rules: monitor a small set of indicators, check liquidity, and note recent news. This helps you judge if a move is a signal or noise.
In practice, combine these checks into a routine before sizing positions and setting stops to manage risk effectively.
Key metrics and indicators for market analysis

Market analysis for crypto investors relies on a few clear, repeatable metrics to spot risks and opportunities. Focus on simple signals first, then layer more data as you learn.
These metrics help you judge strength, volatility and liquidity without getting lost in noise.
Price and volume basics
Price moves are the primary signal. Volume confirms whether a move has backing or is likely to fade.
Look for price breaks with rising volume; that often signals a real shift rather than a short spike.
Volatility measures to watch
Volatility tells you how fast price can change and helps set stop levels.
- Historical volatility: shows past price swings using standard deviation.
- Average True Range (ATR): gives recent range size and guides stop placement.
- Implied volatility: from options, it shows what traders expect next.
- Bollinger Bands: widen with volatility and help spot breakouts or squeezes.
Combine these to see if a move is routine or extreme. High implied but low historical volatility can mean traders expect a big event.
Short spikes often reverse; sustained wide bands with volume more often mark a trend.
Momentum and trend indicators
Momentum shows whether strength is building. Simple tools work best for quick reads.
- Moving averages: identify trend direction and dynamic support or resistance.
- RSI: highlights overbought or oversold conditions.
- MACD: checks crossovers and trend shifts.
Use these to time entries and exits. If price is above a rising moving average and RSI supports strength, the trend is likelier to continue.
Also watch cross-asset moves. Bitcoin swings often steer altcoin momentum and can change indicator signals across the market.
Liquidity and market depth
Liquidity affects how much price moves when orders hit the market. Thin books mean larger slippage.
Track bid-ask spread, order book depth and recent big trades to judge how much selling or buying a token can absorb.
- Bid-ask spread: tight spread equals easier entries and smaller costs.
- Order book depth: shows how much volume sits at each price level.
- Large trade prints: signal where big players are acting and can predict short-term shifts.
When liquidity is low, reduce position size or widen stops to avoid being stopped out by normal noise.
Mix these metrics into a checklist you review before placing a trade: trend, volume confirmation, volatility context and liquidity. That routine helps you act with clearer odds and manage risk.
Keep the set small, update it with experience, and use market analysis for crypto investors as a practical guide rather than a perfect forecast.
Practical risk management strategies for investors
Market analysis for crypto investors helps you define clear rules to protect capital. Simple, repeatable practices reduce stress and costly mistakes.
Focus on steps you can follow every trade: size, stops, and limits that match the market’s behavior.
Define risk per trade
Decide a fixed percentage of your capital to risk on each trade. This keeps one loss from wiping out your gains.
Use stop-loss and take-profit rules
Stops prevent large losses; take-profits lock winnings. Set them based on recent volatility, not guesswork.
- Risk percent: common range is 0.5%–2% of total capital per trade.
- ATR-based stops: place stops a multiple of ATR to avoid normal noise.
- Risk-reward: aim for at least 1:2 to ensure profits beat losses over time.
- Position caps: limit exposure to any single coin or sector.
Adjust size when volatility spikes. If ATR doubles, consider halving position size to keep risk steady.
Also, split entries or use scaling to reduce timing risk. Small staggered buys or sells let you manage surprises without large immediate exposure.
Portfolio-level controls
Think beyond single trades. Allocate capital across strategies and assets to lower overall risk.
Set a max allocation per asset and a reserve for rebalancing or opportunistic buys after sharp drops.
Use continuous checks: review significant holdings weekly and rebalance when weights drift beyond set limits.
Keep an emergency plan. Define triggers to cut risk when market-wide stress rises, such as a sharp drop in Bitcoin or major liquidity loss.
Automate where possible. Order types, alerts and limit rules reduce emotional errors and enforce your plan.
Finally, document your rules and review performance. Small, consistent adjustments based on real results improve your edge over time.
Building a plan: position sizing and stress testing
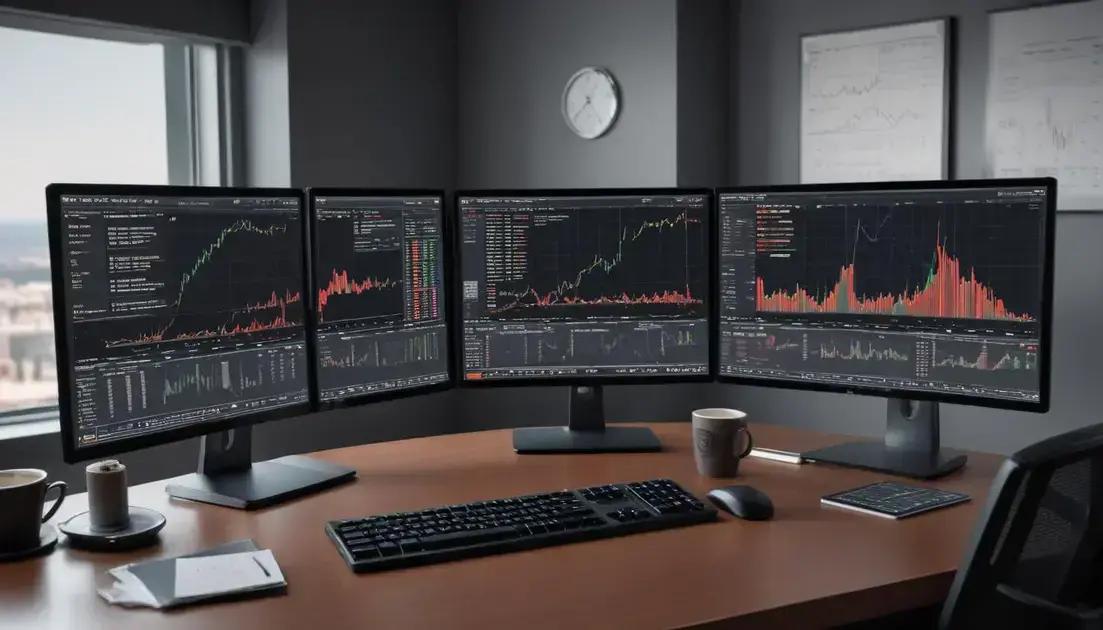
Market analysis for crypto investors makes a plan practical, not guesswork. Good plans set position sizes and test how your portfolio holds up in bad moves.
Small steps like fixed rules and simple scenarios protect capital and make decisions clearer under stress.
Position sizing methods
Choose one method and apply it consistently. That keeps emotions out of sizing choices.
- Fixed fractional: risk a set percent of capital per trade (common range: 0.5%–2%).
- Volatility-based (ATR): size positions so stops are a multiple of ATR, keeping risk stable when volatility changes.
- Risk parity or allocation caps: limit exposure per asset or sector to avoid concentration.
Practical sizing steps: pick your risk percent, set a stop based on recent volatility, then calculate position size so the dollar risk matches your rule. For example, with $10,000 capital and 1% risk, your max dollar loss is $100. If your stop equals a 2% move, size the position so a 2% move equals $100 risk.
Use small, repeatable rules: caps per asset, max open positions, and reduced size during spikes in ATR. Automate calculations in a spreadsheet or tool to avoid errors.
Stress testing approaches
Stress tests show how a plan behaves in bad scenarios. They force you to face realistic losses and liquidity issues before they happen.
- Historical scenarios: replay past crashes or big drawdowns to see portfolio impact.
- Hypothetical shocks: model sudden drops (20%–50%) or rapid volatility spikes in key tokens.
- Liquidity stress: assume wider spreads and lower order book depth to estimate slippage and execution risk.
Simple stress test: apply a drop in the largest holding and recalc portfolio value and margin needs. Note if any positions breach your allocation caps or margin thresholds.
Monte Carlo-style checks add random sequences of returns to estimate range of possible outcomes. You don’t need complex software: run a few scenarios with varied returns and see how many wipe out planned risk limits.
Practical checks and routines
Turn sizing and stress tests into a short checklist you run before large trades or weekly reviews. This keeps discipline and makes adjustments clear.
- Confirm risk percent and dollar risk per trade.
- Set stop based on ATR or recent structure, not emotion.
- Verify portfolio allocation limits and current weights.
- Run one quick stress scenario (e.g., -30% on main holdings) and confirm capital adequacy.
Keep rules simple and repeatable. If a stress test shows unacceptable drawdown, reduce size, add hedges, or increase reserves before taking new risk.
Document your plan and review performance monthly. Small changes after real trades and tests improve the plan over time and make market analysis for crypto investors a tool to manage risk, not a source of guesswork.
FAQ – Market analysis for crypto investors
What causes crypto market volatility?
Volatility often comes from low liquidity, big orders, news events and high leverage. Retail flows and algorithmic trading can amplify moves quickly.
Which indicators should I watch first?
Start with volume, ATR, moving averages and RSI. Also check order book depth to gauge liquidity and real price impact.
How much should I risk per trade?
A common rule is 0.5%–2% of total capital per trade. Use ATR-based stops so your dollar risk stays consistent when volatility changes.
How do I stress test my crypto portfolio?
Replay past crashes, model sudden drops (e.g., −20% to −50%) and assume wider spreads. Check allocation caps, margin needs and slippage to see weak points.